
Feature Refresher: Nebula’s Robust Workflow Reporting Suite
Visibility that Drives Smarter Decisions
Visibility is key in eDiscovery. Review teams rely on accurate, timely reporting to view performance, track progress, and make informed decisions at every stage. And without clear insight into activity and results, projects risk delays and inefficiencies that can impact outcomes.
That’s exactly why reporting has become essential in legal technology. From matter management to review analytics, data-driven visibility enables faster issue detection, smarter planning, and better communication across teams and clients. Nebula’s Workflow Reporting Suite was built with this in mind, giving users a clear, real-time view of what’s happening across cases.
A Closer Look into Nebula’s Reporting Tools
Nebula’s Workflow Reporting Suite brings together tools that help teams monitor, measure, and share progress with precision. Users can access multiple report types displaying key metrics such as document counts, coding trends, and completion rates. Custom filters and views tailor reports to specific needs, while data exports make it easy to share insights internally or with clients.
The Workflow Reporting Suite collects review statistics and presents them as interactive charts and graphs across several key reports:
Reviewer Metrics – Tracks reviewer productivity and activity.
Prevalence – Shows frequency of a single tag by stage and over time.
Tags Applied – Displays tag usage across reviewers and time periods.
User Activity – Summarizes workflow activity and Nebula usage.
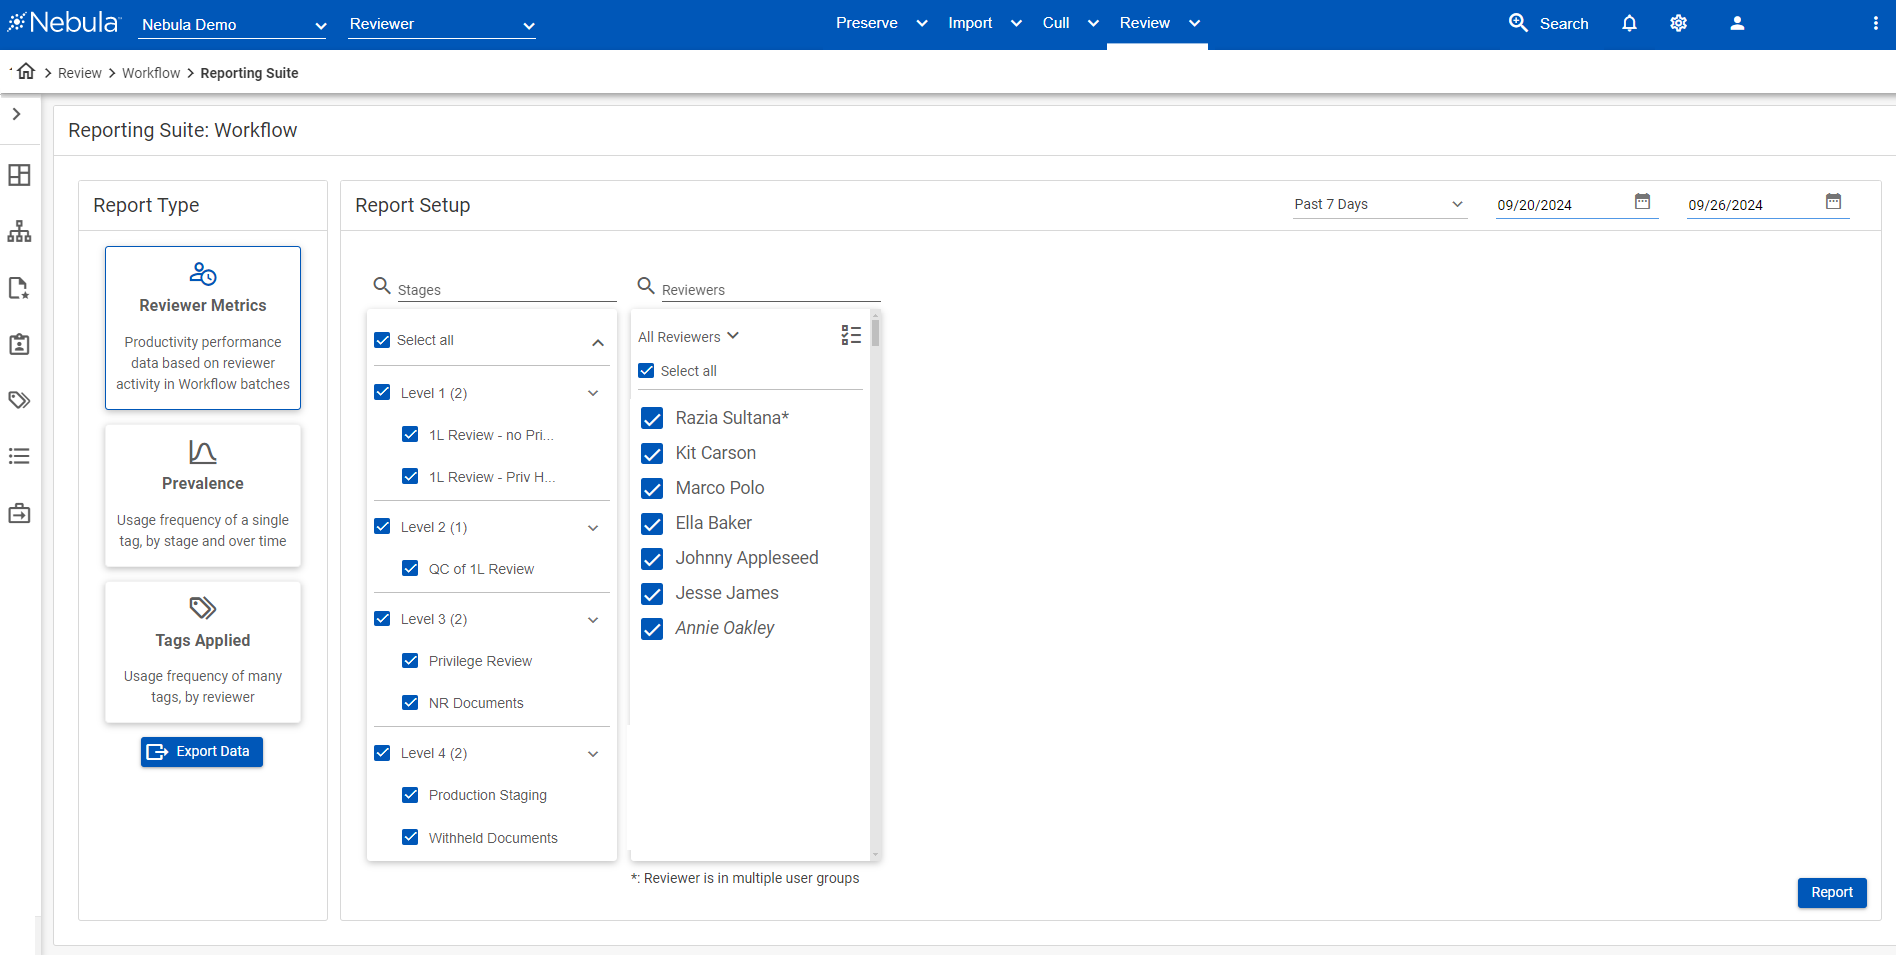
Reviewer Metrics Setting
Key Features:
Matter and Workflow Reports – View detailed metrics on assignments, status, and progress.
Activity Dashboards – Visualize performance and document throughput at a glance.
Customizable Filters – Refine reports by user, tag, date range, or stage type.
Data Exports – Share findings or archive reports in Excel format.
Real-Time Metrics – Access live updates to monitor workload and progress.
Together, these tools give project managers and case teams the visibility they need to keep reviews efficient, transparent, and defensible.
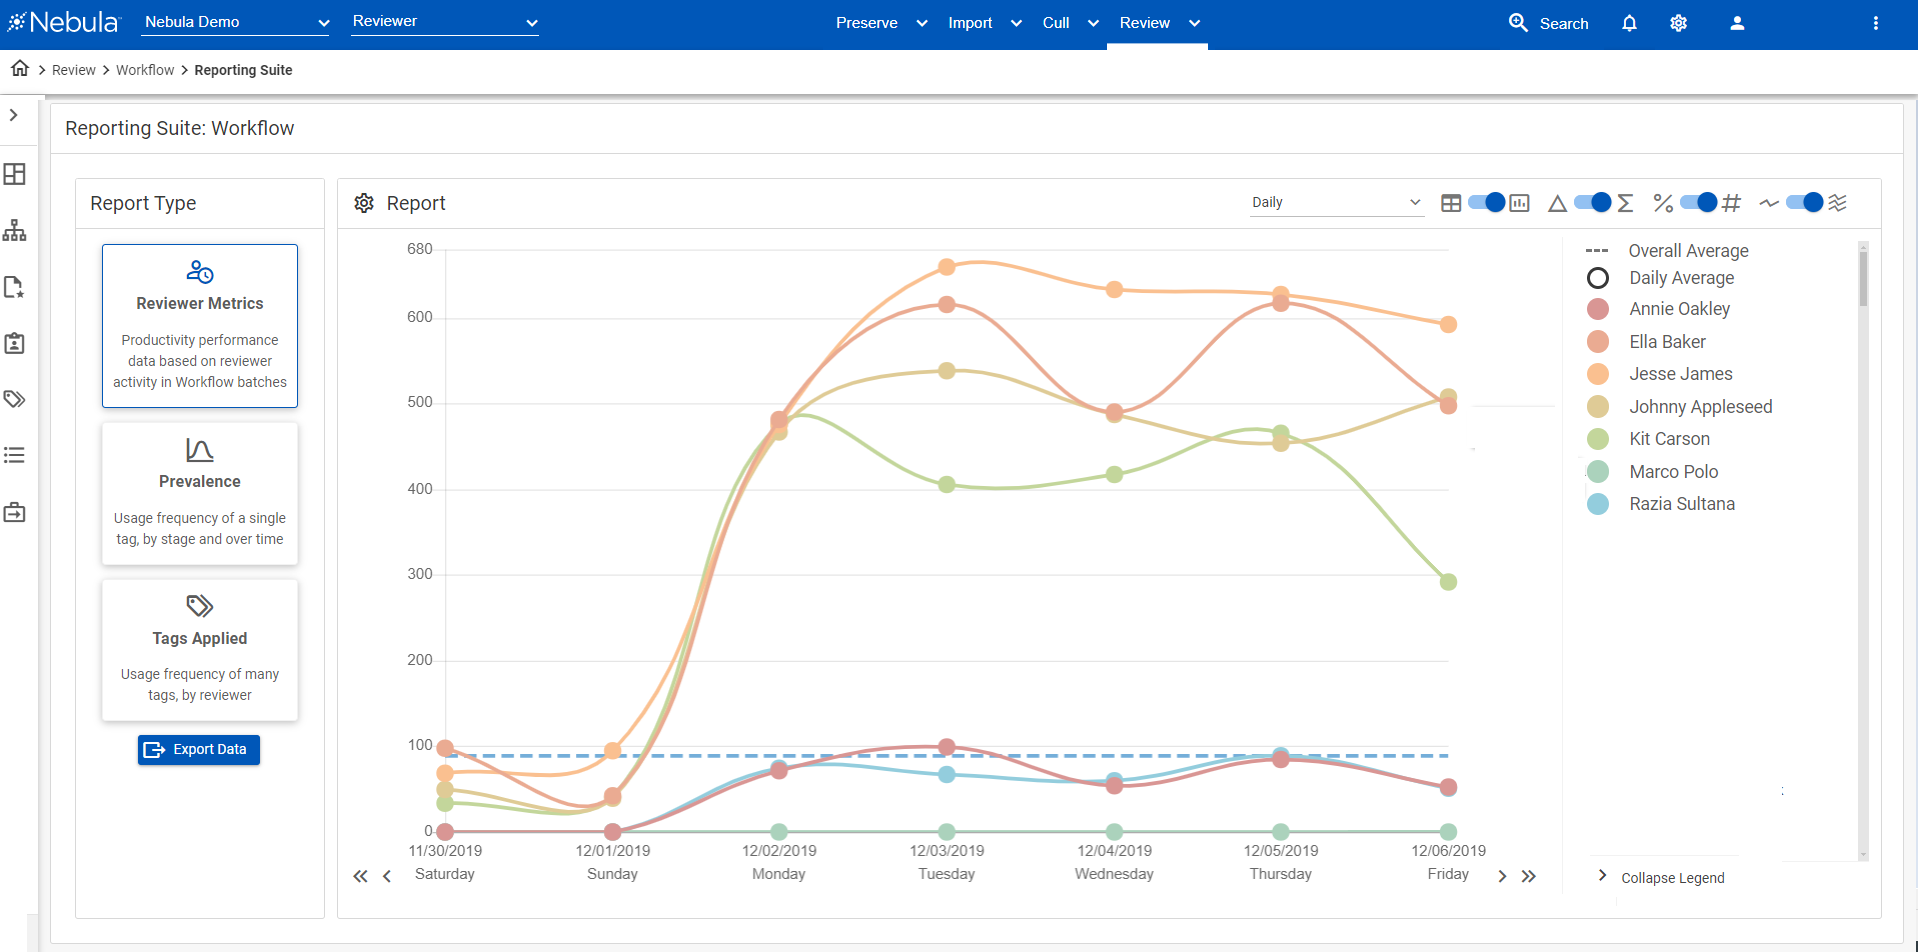
Reviewer Metrics Graph Report
How to Generate and Share Reports
Generating and exporting reports in Nebula is quick and intuitive:
From the Explore pane, select Workflows.
Choose a workflow, click the Action icon, and select Reporting Suite.
On the Workflow Reports page, select a report type such as Reviewer Metrics, Prevalence, or Tags Applied.
In Settings, select which data to include and set a Date Range (7 days, 14 days, 30 days, full history, or custom).
Click Report to generate results, then adjust the display — choose between table or graph, change time increments, or view data as sum, delta, or percentage.
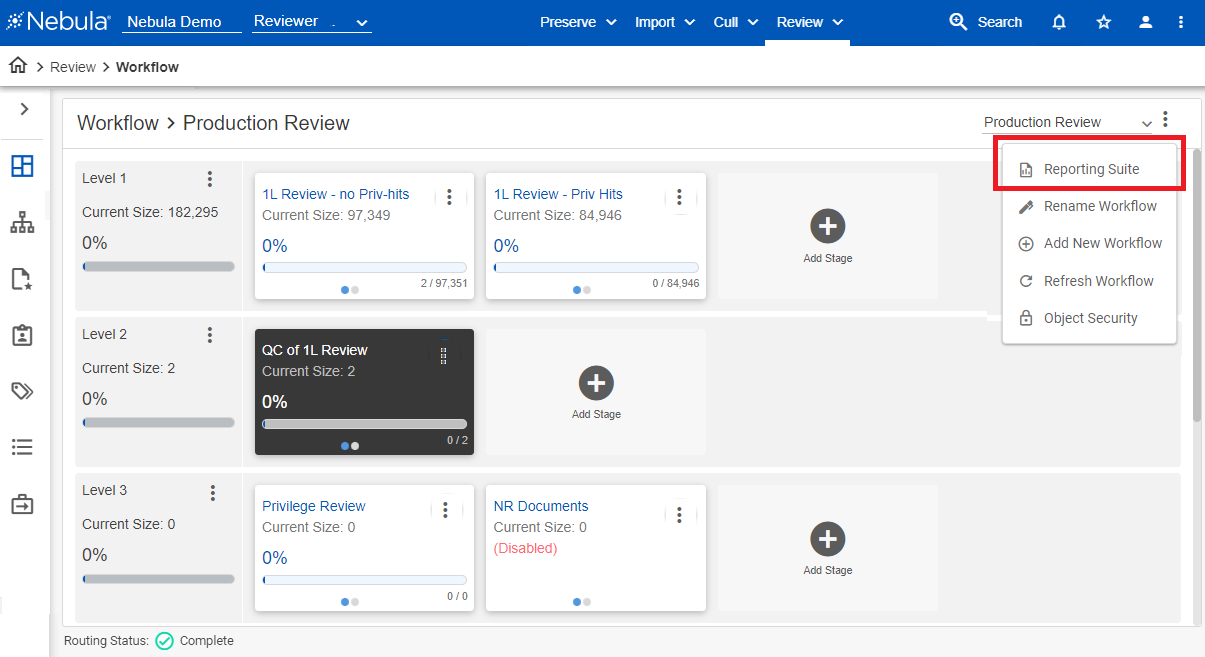
Workflow Reporting Suite
To update a report, click the Settings icon to modify filters or data fields.
To export, download Reviewer Metrics and Prevalence reports as XLSX files, each appearing on its own worksheet tab. Exports include table data for each day in your selected range.
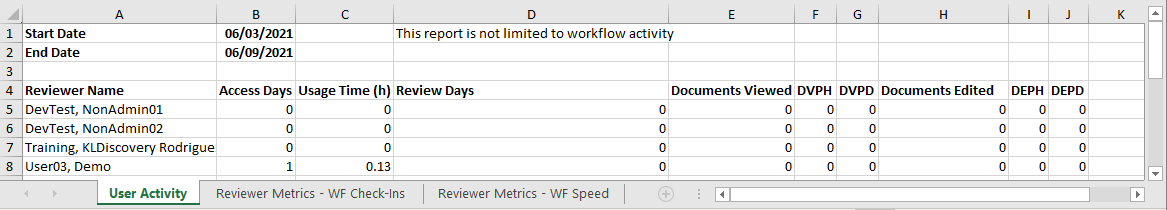
Activity Tab Report
Experience Smarter Reporting in Nebula
Nebula’s Workflow Reporting Suite gives review teams the insight they need to make informed, data-driven decisions. Whether tracking performance, measuring progress, or sharing updates with clients, these tools turn project data into actionable intelligence.
Try Nebula’s Workflow Reporting Suite on your next matter to see how visibility can drive better results and greater confidence throughout your review process.
For detailed steps, report types, and configuration options, visit the Nebula Workflow Reporting Suite Guide.